In the fire service, every decision is vital. Seconds matter. When lives are on the line, your department cannot afford to have subpar response times. Response Reliability is crucial. The populations your department serves rely on you to be there when it matters. At Fire Services Analytics, I leverage forecasting and response data to give you a unique and detailed view of your fire service.
Successful fire departments are evidenced based and know that data is just as important as experience and intuition. I will help your department generate actionable insights and further integrate data analysis into your strategic decisions.
Whether it's Station Placement Analysis or Effective Response Force Analysis, I will find the gaps in your coverage. Utilizing spatial, predictive, and prescriptive analysis, I will comb through your data and find ways to

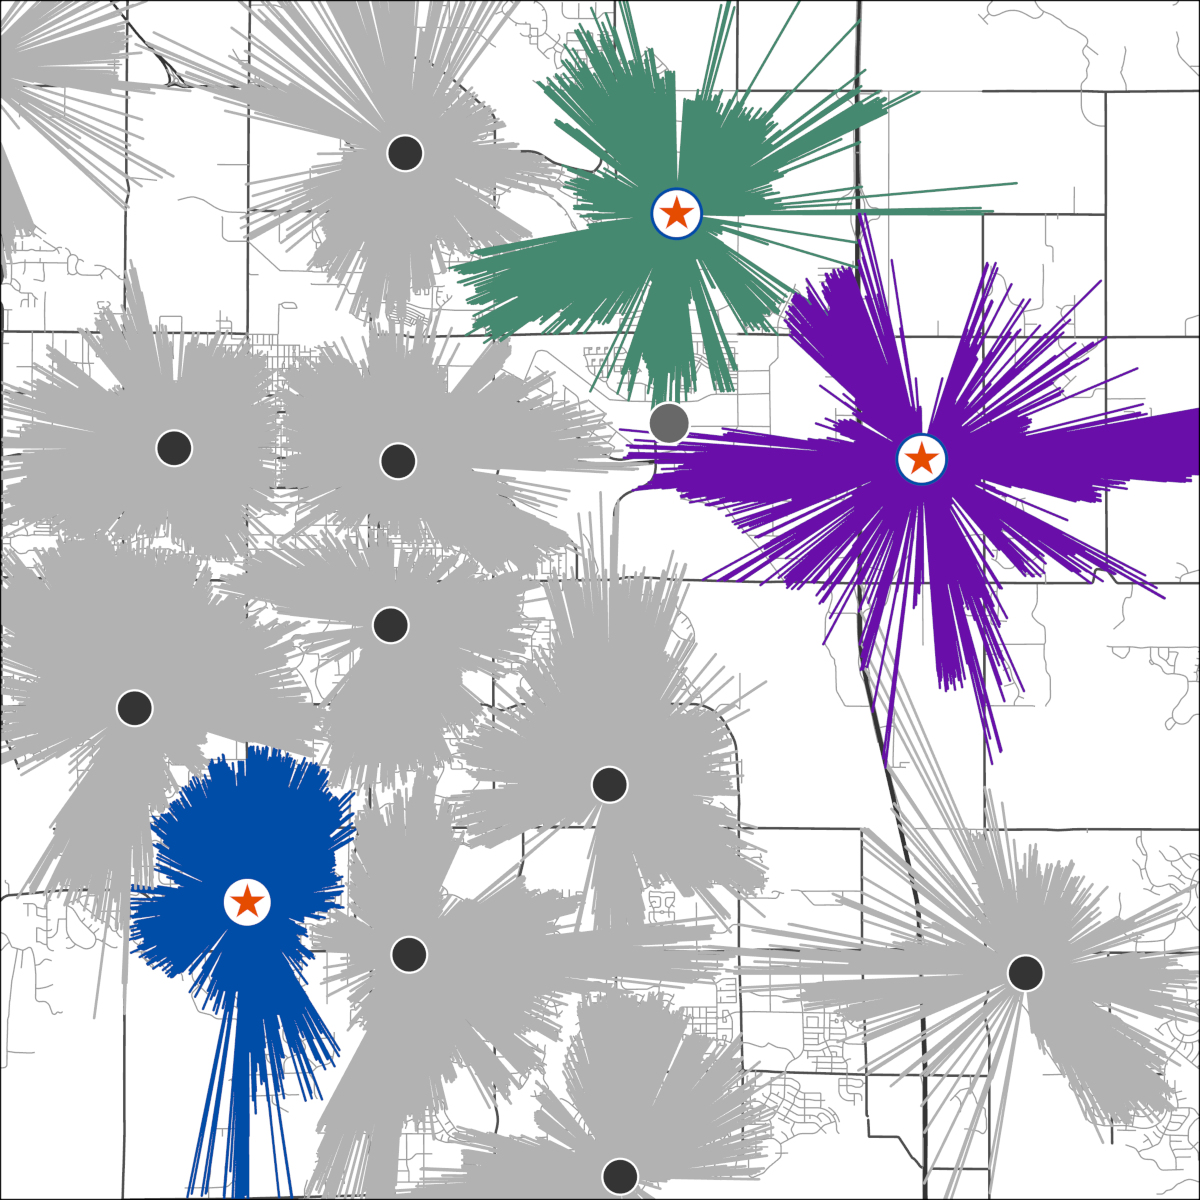
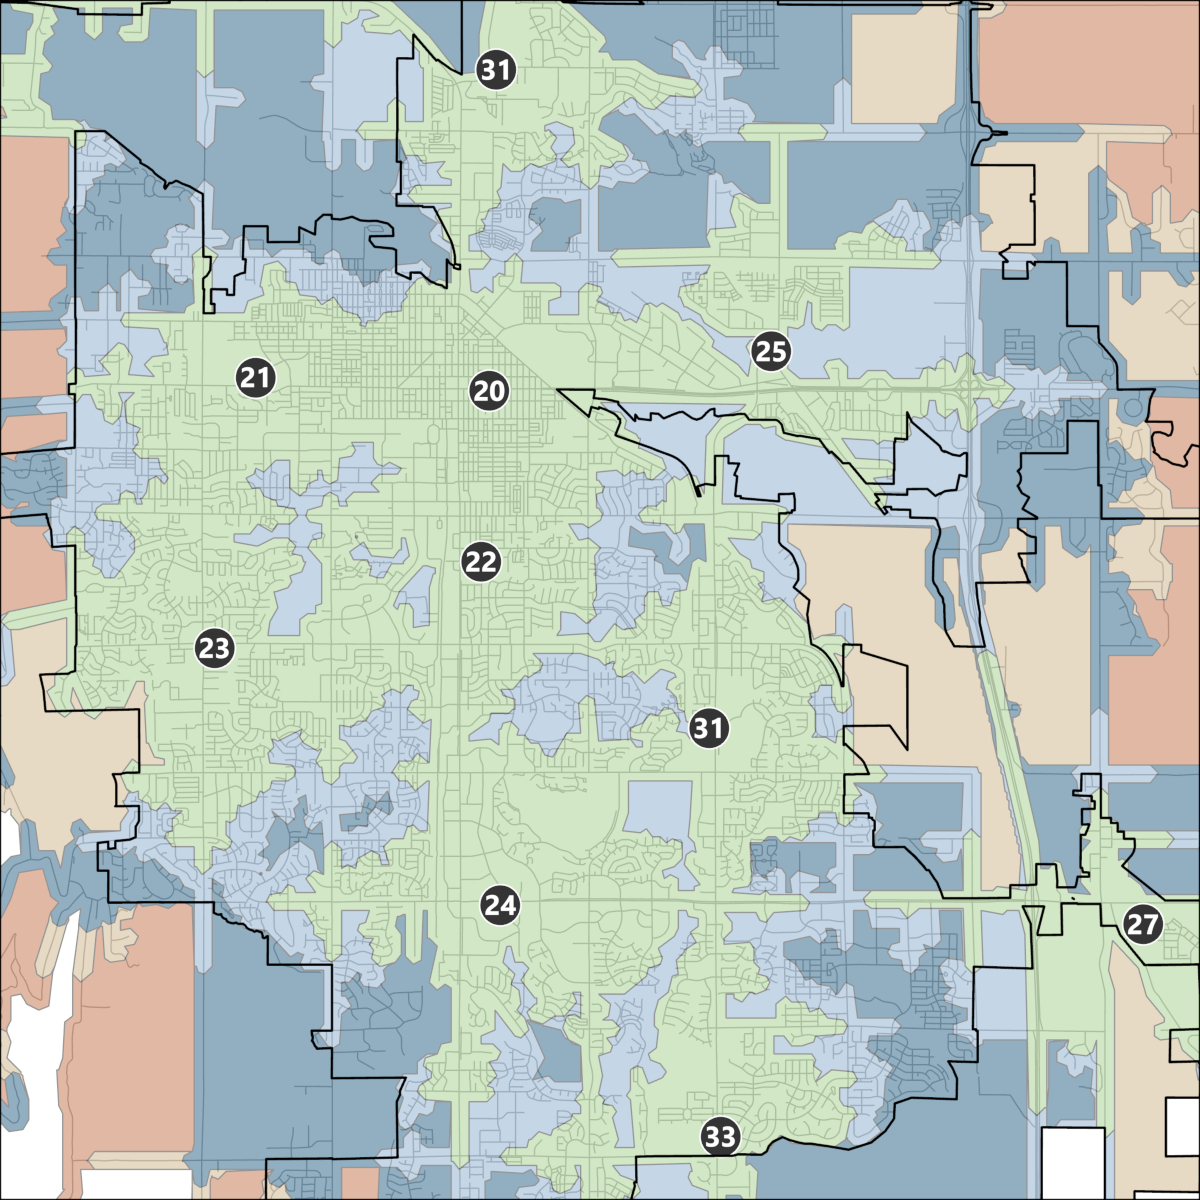
Station location analysis provides you with a vital roadmap to prepare for future growth and planning. During this process I will:
You will gain a deep understanding of where you are meeting your benchmarks and where there are coverage gaps across the district. Understanding your response coverage helps you plan for future growth, assess the need for additional apparatus, and ensure you are providing quality service to your community.
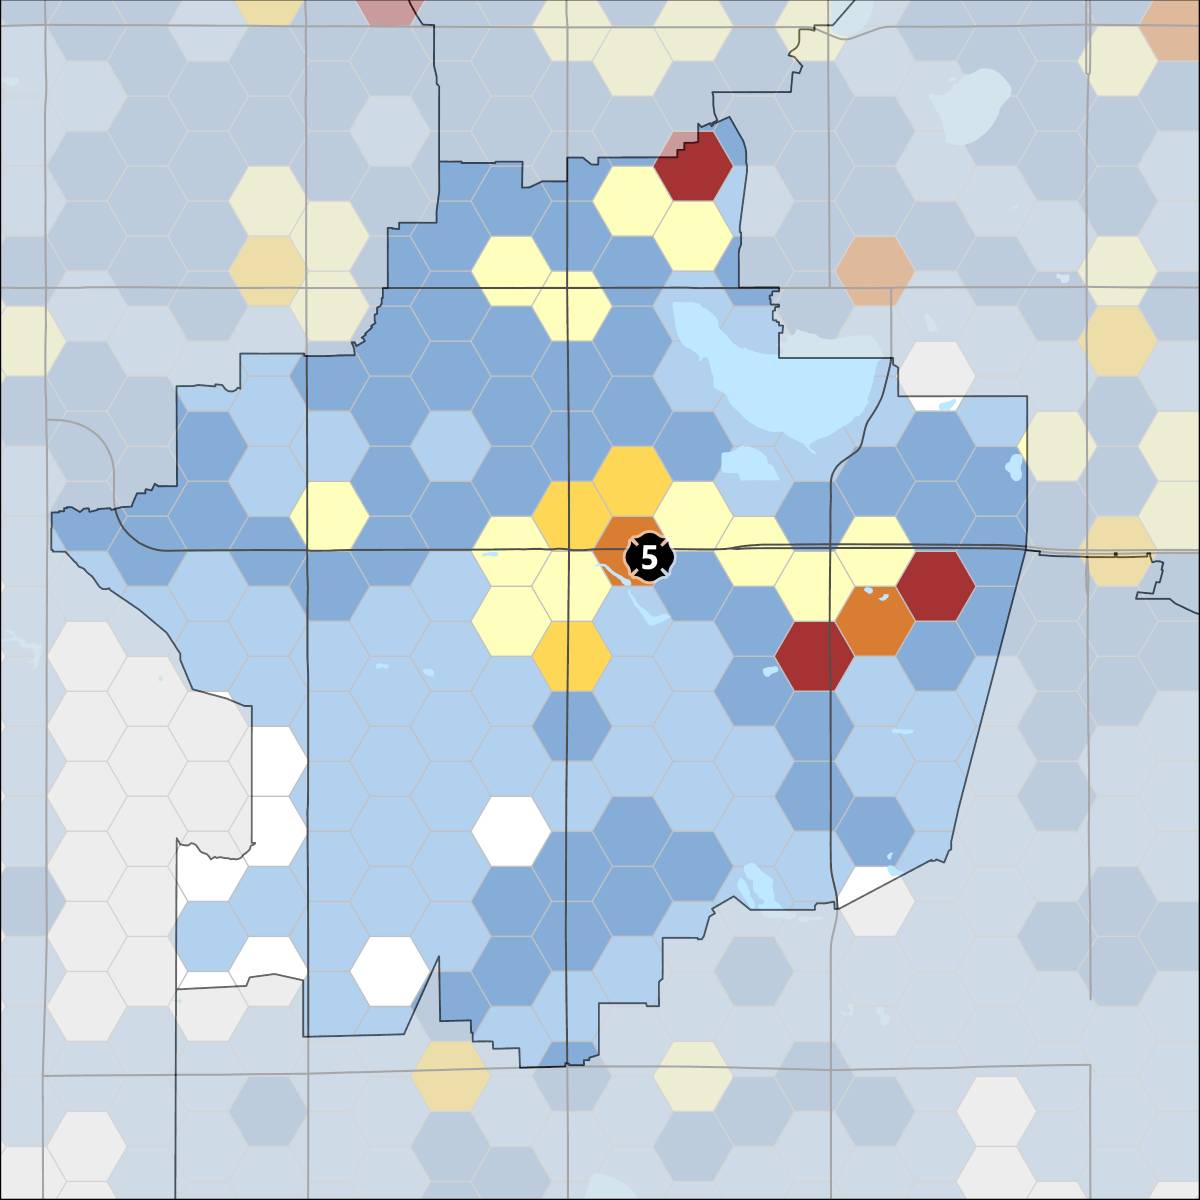
When you understand where the highest call volume is for defined incident types, you can target areas for community risk reduction, assess your deployment model, and have a clear understanding of community needs. Examples include: